




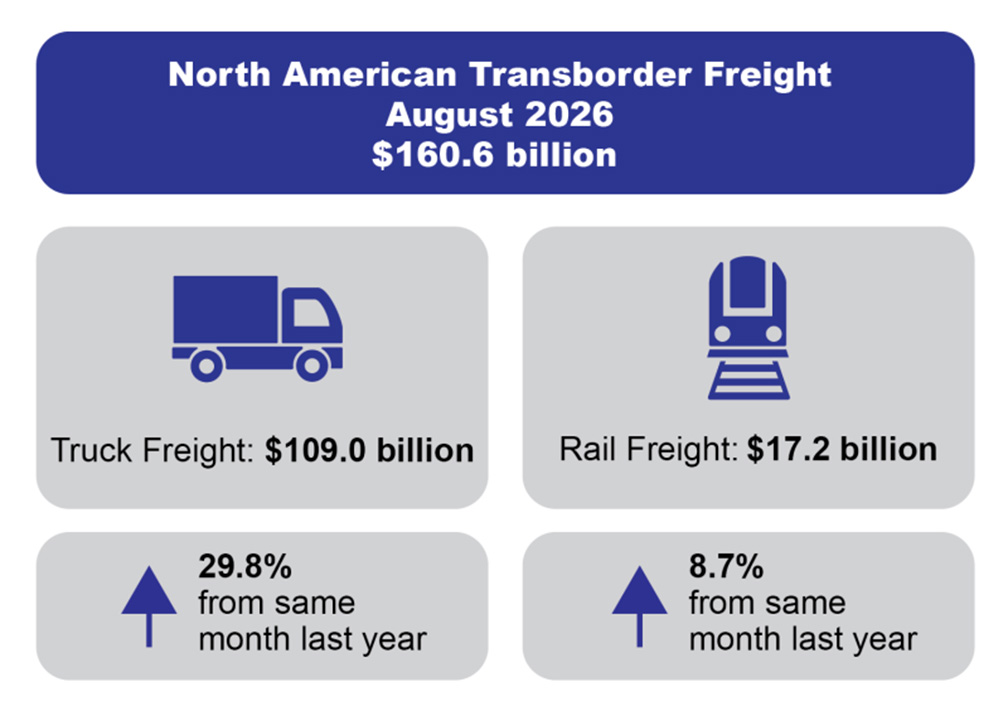
WASHINGTON — Trucks hauled $109 billion in freight across the United States’ borders with Canada and Mexico in August 2026, a 29.8% increase compared with the same month last year, according to new data from the U.S. Department of Transportation’s Bureau of Transportation Statistics (BTS).
The figures, released Oct. 21, show that trucking accounted for approximately 68% of the $160.6 billion in freight transported between the U.S. and its North American trading partners during the month.
Overall transborder freight increased 22.6% compared with August 2025.
Mexico accounts for largest share of truck freight
Trucks transported $73.9 billion in freight between the U.S. and Mexico during August, compared with $35.2 billion between the U.S. and Canada.
Mexico accounted for approximately 68% of the total value of transborder freight transported by truck.
Across all transportation modes, freight between the U.S. and Mexico totaled $94.3 billion, an increase of 26.7% year over year. U.S.-Canada freight reached $66.3 billion, up 17.1%.
Trucking outpaces other transportation modes
Trucking recorded the largest year-over-year percentage increase among the five transportation modes highlighted in the BTS report.
Rail freight totaled $17.2 billion, an increase of 8.7%, while pipeline freight reached $10.2 billion, up 22.7%. Freight transported by vessel totaled $9.7 billion, an increase of 12%, and air freight rose 3.8% to $6.7 billion.
Texas leads major freight crossings
Laredo, Texas, remained the nation’s leading transborder freight port, handling approximately $37.7 billion in goods during August. Other leading ports included Ysleta, Texas, at $15.8 billion; Detroit, Michigan, at $13.9 billion; Port Huron, Michigan, at $8.4 billion; and Buffalo-Niagara Falls, New York, at $7.1 billion.
BTS identified Detroit, Port Huron and Buffalo as the leading truck freight crossings along the Canadian border. Laredo, El Paso and Otay Mesa, California, were the leading truck crossings along the Mexican border.
Machinery and vehicles lead freight categories
Computer-related machinery and parts represented the largest commodity category in transborder freight, valued at approximately $40.9 billion.
Vehicles other than railway equipment followed at $21.1 billion, while electrical machinery, equipment and parts accounted for $19.7 billion. Mineral fuels, oils and waxes represented another $19.2 billion.
These figures cover freight transported by all modes, not trucking alone.
Understanding the numbers
BTS tracks the value of goods moving between the U.S., Canada and Mexico by transportation mode, commodity and geographic location.
The agency notes that its figures are reported in current U.S. dollars and are not adjusted for inflation. The statistics may also be revised as additional information becomes available.
Because the report measures the dollar value of freight rather than shipment volumes or truck traffic, the increases do not necessarily indicate a corresponding rise in the number of loads transported.

Linda Garner-Bunch has been with The Trucker since 2020, picking up the reins as managing editor in 2022. Linda has nearly 40 years of experience in the publishing industry, covering topics from the trucking and automotive industry to employment, real estate, home decor, crafts, cooking, weddings, high school sports — you name it, she’s written about it. She is also an experienced photographer, designer and copy editor who has a heartfelt love for the trucking industry, from the driver’s seat to the C-suite.