



When operational costs are high, knowing your cost per mile helps you make good decisions
It took a while to get here, but small trucking businesses are finally finding higher freight rates and greater revenue opportunities than have been offered in the past few years. The higher rates, however, are at least partially driven by higher costs, especially fuel. It’s vital to your business to know your operational cost so you can determine if higher revenues are covering increased costs.
The U.S. Energy Information Administration publishes average gasoline and diesel fuel prices every Monday (except holidays) at eia.gov/petroleum/gasdiesel. The report provides national average retail prices, as well as average prices for different regions of the country.
The Monday, Sept. 21, 2026, report showed a national average price of $6.529 per gallon. Although higher prices may have occurred on a spot or temporary basis, it’s the first time the national average gallon price has topped $6. If you purchase your fuel in California, the average price shot above $8 per gallon for the first time. Even in the Gulf Coast region — typically the cheapest area for fuel — pricing exceeded the $6 mark at $6.027 per gallon.
This means record high prices for trucking operations.
Many Class 8 trucks average 6 to 6.5 mpg. Modern trucks can perform significantly better; but idling, traffic congestion and higher speeds can keep any vehicle from reaching maximum fuel economy.
At the national average gallon price of $6.529, small trucking businesses may find their diesel fuel costs have reached $1 per mile or more.
Higher fuel costs impact more than “just” the per-gallon price of diesel.
Petroleum-based fluids, like engine and other oils, see price increases, too. Oil-derived products, like plastics, cost more to manufacture. This impacts the cost of parts — and the cost of shipping those parts to maintenance facilities has gone up, too. Tires are more expensive, too.
Even the interest rate paid on your next truck loan could be impacted.
On Sept. 16, 2026, the Federal Open Market Committee voted unanimously to increase the federal funds rate by a quarter percentage point. It was the first such increase in three years. The action came as inflation remained elevated, with crude oil prices above $100 per barrel contributing to increased price pressures. Fed policymakers indicated that another rate increase could come before the end of the year.
So, where do freight rates fit into the profitability picture?
According to data received from DAT Freight & Analytics, the seven-day rolling average linehaul freight rate for dry van, as determined from the DAT load board, was $2.17 per mile, excluding fuel surcharge. That figure is up 31.5% from the same week of 2025, an increase of 52 cents per mile. In contrast, the third week of September 2025 only rose 4 cents per mile from the same week in 2024.
Rates are definitely improving.
Refrigerated rates rose from $2 to $2.73 over the past year, according to DAT, an increase of 36.5%. Flatbed linehaul rates for the same period rose 55 cents, landing at $2.60 (that’s up 26.8%. However, expenses for these segments may be different from dry van expenses: Refrigerated trailers require fueling, and flatbed operations incur expenses for tarps, dunnage and securement equipment.
Here’s how owner-operators can work to maintain (or even improve) their bottom line.
The first order of business when considering a load is to make sure the fuel surcharge is covered. If the rate does not specify a surcharge amount, visit the EIA website and make a note of the current national average for diesel fuel in the U.S.
For example: The national average for diesel fuel in the third week of September 2025 was $3.75. This year, it’s shot up more than $2.50 per gallon (that’s a 67.8% increase) for the same time frame.
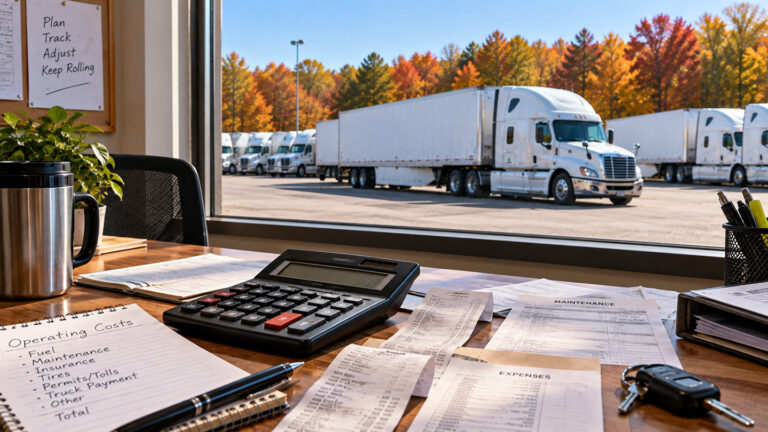
Now, it’s time to pull out your calculator. You should be able to divide that $2.54 increase by your average fuel mileage to determine how much your fuel cost per mile has increased.
Ask yourself: Have your freight rates, including any fuel surcharge, increased enough to cover the difference? If you’re tracking your other operational costs (as you should be), you can calculate how much more revenue you’ll need to cover your increased expenses.
There are resources to help you decide what’s needed.
The American Transportation Research Institute (ATRI) released its 2026 update to its Analysis of the Operational Costs of Trucking in July, providing some average trucking costs increases reported by survey respondents. The report is free, and it can provide some guidelines even if you don’t detail expenses for your operation.
The average operational cost per mile in the truckload sector in 2025 was $1.72, according to ATRI. That figure includes driver pay and benefits cost. Additionally, truck insurance, tolls, maintenance and truck lease or purchase payments continued to rise through the first quarter of 2026. It’s safe to assume that the 2025 cost of $1.72 has already grown to $1.80 per mile and is likely to be even higher, considering fuel increases.
Taking the DAT average dry van freight rate of $2.17 per mile, excluding fuel surcharge, and assuming operational cost of $1.80 per mile leaves just 37 cents per mile for driver pay and benefits — an amount many trucking business owners would determine isn’t worth their time and effort to manage the business.
Fuel efficiency can make a big difference.
It’s important to note that the ATRI operational cost estimates include fuel costs, so the fuel mileage achieved by your equipment can make a huge difference.
At the current EIA national average of $6.529, a truck that gets 5 mpg consumes $1.26 in fuel every mile. If your truck gets 6 mpg, and your cost per mile drops by 21 cents. Multiplied by a month’s worth of miles or more, the cost adds up quickly.
For example: If your truck runs 100,000 miles in a year, the difference between achieving 5 mpg and 6 mpg is 3,333 gallons of fuel. Multiply those gallons by $6.529 and you’ll see that the truck getting five MPG will burn nearly $22,000 in additional fuel expenses in a single year.
Drivers know that keeping speed down and avoiding idling help increase fuel mileage. So does investment in aftermarket aero products such as wheel covers, fairings, trailer skirts, flow-through mud flaps and other products.
It all begins, however, with knowing your operational cost per mile.
Knowing where your business revenue is being spent helps you determine the areas where cost savings will have the largest impact. It also helps you make sound decisions about which loads, and which rates, will help your business profit.

Cliff Abbott is an experienced commercial vehicle driver and owner-operator who still holds a CDL in his home state of Alabama. In nearly 40 years in trucking, he’s been an instructor and trainer and has managed safety and recruiting operations for several carriers. Having never lost his love of the road, Cliff has written a book and hundreds of songs and has been writing for The Trucker for more than a decade.