



The cost of running a trucking operation continues to climb, with several major expense categories rising faster than inflation, according to the latest analysis from American Transportation Research Institute (ATRI).
Each year, ATRI issues a report outlining trends in the cost of trucking, broken down to a per-mile basis so that each carrier can identify trends and measure the impact on their own profit and loss statement.
This year’s report, “Analysis of the Operational Costs of Trucking: 2026 Update,” was released July 15. The data reflect in this year’s report explores changes from 2024 to 2025. On August 6, ATRI presented a webinar to explain some of the findings in the report.
Dr. Alex Leslie, senior research associate, and Daniel Murray, senior vice president of ATRI, spoke during the webinar about their findings.
Costs associated with trucking continue to rise
According to the report, trucking costs, not considering fuel, rose by 4.2% from 2024 to 2025. While fuel prices began rising in 2024, they actually decreased in 2025. That 4.2% increase exceeded the inflation rate for 2025 (2.7%), Leslie noted.
The average operational cost for 2025 was $1.854 per mile — up 4.2% from the 2024 average of $1.779. It should be noted, however, that driver wages made up 81.8 cents of the average, with another 21 cents per mile attributed to driver benefits. If you’re an owner-operator and do not hire drivers, you should be able to compare your take-home to those numbers. After subtracting driver pay and benefits, the average operational cost before fuel for 2025 was 82.6 cents per mile.
Preliminary data for the first quarter of 2026 suggests that operational costs rose again this year, but the final numbers won’t be available until next year’s report from ATRI.
Tolls post the biggest increase
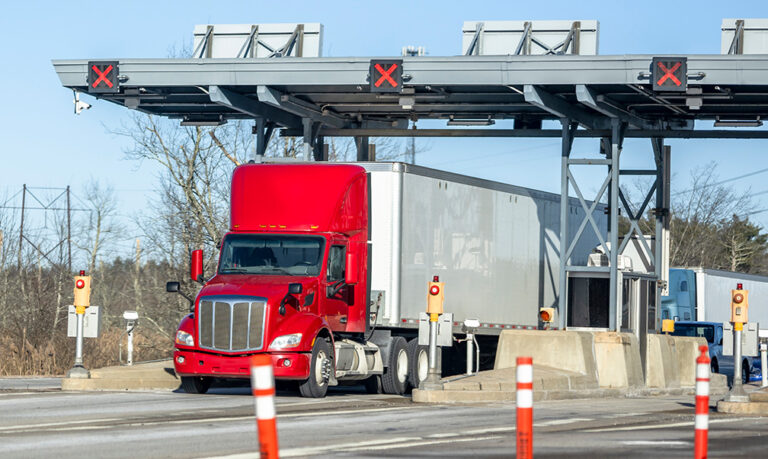
The largest increase in costs from 2024, on a percentage basis, was the category of tolls. Carriers paid an average of 4.3 cents per mile in 2025, up 13.2% from the prior year and up 34.4% from the COVID recessionary year of 2021. Tolling authorities have raised prices to combat increases in construction costs and expenses of modernization, along with other reasons. As always, carriers must choose whether routing to avoid toll roads results in savings, considering the potential loss of efficiency or greater miles traveled.
Aging equipment drives maintenance costs higher
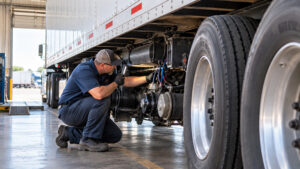
The next largest increase is one that impacts more trucking businesses, repair and maintenance. The report shows an average cost per mile of $0.215, up 8.6% in 2025 from 2024. Preliminary 2026 data shows another increase of 2.4%. It’s important to note that the repair and maintenance statistics do not include expenses for tires, which were surveyed separately. Repair and maintenance costs include parts, labor and roadside service expenses.
The study attributes part of the increase in maintenance costs to aging equipment.
Sustained low freight rates in the past few years, along with rising new equipment prices and higher interest rates, have pushed carriers to hold on to their equipment longer, increasing maintenance requirements and costs. Costs for small carriers — those of five trucks or less — were even higher, credited to the fact that many small carriers purchase older, used equipment that requires more maintenance and repair and often comes with short-term warranty if any at all.
Tire costs for both parts and labor increased 6.4% in 2025 to a nickel per mile. Tariffs on natural rubber imposed on Southeast Asian countries and synthetic rubber costs associated with petroleum prices were cited as causes for the increase.
Insurance remains a costly issue
Another expense area that’s seen increases above the inflation rate is truck insurance premiums. The numbers also show that smaller carriers are hit harder by the increases than larger ones, but when all is considered, the total cost per truck isn’t much different.
ATRI reports that the average cost per mile for insurance in 2025 was 10.6 cents, up 3.9% from 2024 and up 23.9% from 2021. Nuclear verdicts — lawsuit awards against larger carriers considered to have “deep pockets” — are blamed for much of the increase. It remains to be seen what impact FMCSA actions such as the removal of non-domiciled carriers and changes to the carrier registration system will have on insurance rates, if any.
FMCSA data already shows an improvement in 2024 truck-involved crash rates, which fell 15.3% from their high point in 2019, and fatal crash rates for the same period fell by 13.9%. Despite these gains, the study noted, the trucking insurance industry has been unprofitable in nine of the past 10 years. Costs per crash have risen dramatically, in part due to health care costs far exceeding the general inflation rate.
As mentioned, smaller carriers paid more for insurance premiums than larger carriers, but the study notes that “premiums for insurance coverage should be understood as one key component of a carrier’s total cost of risk.” Those total costs also include larger deductibles that larger carriers might pay as well as self-insurance some carriers incorporate into their plans. Carrier costs also include litigation expenses, including large settlements. When all is considered, the insurance expense gap between large and small carriers is much smaller.
Costs for permits and licenses actually fell 11.1% in 2025 as agencies adjusted pricing.
Efficiency matters
The study noted that per-mile costs are closely related to operational efficiency and that deadhead or empty mileage can be the single greatest drain on operational costs. Non-tank deadhead mileage was reported at 16.5% in 2025, providing a benchmark for carriers to compare to their own operations.
If you want to know how your operation compares to others across the continent, the ATRI report provides lots of information you need to compare. The full report is available here.
About the study
The ATRI study compared data from participating for-hire carriers, which was corroborated with external sources. For example, data on diesel fuel costs was checked against information published by the U.S. Energy Information Administration. Other corroborating sources were government agencies, industry analysts and trucking associations. The findings represent more than 182,000 Class A trucks running 14.67 billion miles, across the truckload, less-than-truckload (LTL), and specialized industries.
ATRI is a 501(c)(3) not-for-profit research organization who receives funding from state trucking organizations, carriers, brokers, industry-related organizations, private individuals and others. The data supplied through ATRI’s research is used by a broad spectrum of industries, including large and small carriers. The numbers provide a benchmark to which for owner-operators can compare their business results.

Cliff Abbott is an experienced commercial vehicle driver and owner-operator who still holds a CDL in his home state of Alabama. In nearly 40 years in trucking, he’s been an instructor and trainer and has managed safety and recruiting operations for several carriers. Having never lost his love of the road, Cliff has written a book and hundreds of songs and has been writing for The Trucker for more than a decade.