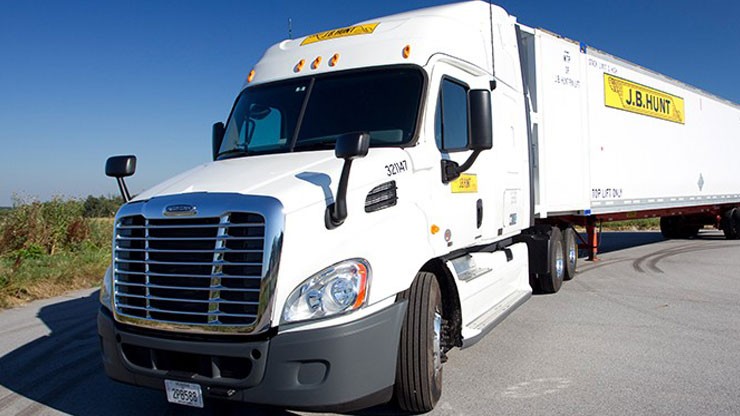
LOWELL, Ark. — J.B. Hunt Transport Services Inc. announced first quarter 2025 U.S. GAAP net earnings of $117.7 million, or diluted earnings per share of $1.17 versus first quarter 2024 net earnings of $127.5 million, or $1.22 per diluted share.
Total Operating Revenue
Total operating revenue for the current quarter was $2.92 billion compared with $2.94 billion for the first quarter of 2024, a decrease of 1%.
The decline in revenue was primarily driven by:
- A 5% decrease in average truck count in Dedicated Contract Services (DCS).
- 15% fewer stops in Final Mile Services.
- 13% fewer loads in Integrated Capacity Solutions (ICS).
- An 8% decrease in Truckload (JBT) gross revenue per load compared to the prior year period.
“These declines were partially offset by Intermodal (JBI) revenue growth of 5%, driven primarily by an 8% increase in load volume,” the company said in a press release. “Current quarter total operating revenue, excluding fuel surcharge revenue, increased modestly versus the first quarter 2024.”
Operating Income
Operating income for the current quarter decreased 8% to $178.7 million versus $194.4 million for the first quarter 2024. The decrease in operating income was primarily due to the decline in:
- DCS revenue.
- Lower yields in JBI.
- Higher insurance claim and premium expense.
- Increased group medical cost.
- Higher equipment and maintenance expense.
“These items were partially offset by lower driver and non-driver personnel counts and corresponding personnel-related expenses, lower bad debt expense and less cargo claims costs compared to the prior-year period,” the company said.
Net interest expense for the current quarter increased approximately 19% from the first quarter of 2024 due to higher average consolidated debt balance and lower interest income.
“The effective income tax rate decreased to 26.5% in the current quarter compared to 28.7% in the first quarter of 2024, due to discrete tax items,” the company said. “We continue to expect our 2025 annual tax rate to be between 24.0% and 25.0%.”
Segment Information
Intermodal (JBI)
- First Quarter 2025 Segment Revenue: $1.47 billion; up 5%
- First Quarter 2025 Operating Income: $94.4 million; down 7%
Intermodal volume increased 8% over the same period in 2024. Transcontinental network loads increased 4%, while eastern network loads increased 13% compared to the first quarter of 2024. Overall demand for our domestic intermodal service offering in the quarter remained strong, delivering the highest first-quarter volume in the company’s history.
“We saw notable strength in our eastern network as service execution and our value proposition continues to drive growth, the company said. “Segment gross revenue increased 5% for the quarter versus the prior-year period primarily driven by the 8% increase in loads, offset by a 2% decrease in segment gross revenue per load, resulting from changes in the mix of freight, customer rates, and fuel surcharge revenue. Revenue per load excluding fuel surcharge revenue was down 1% year over year.”
Operating income decreased 7% from the prior-year period primarily from lower yields combined with increases in professional driver and non-driver wages, higher insurance claim and premium expense, increased group medical costs, and higher equipment storage costs as compared to the prior-year period. These items were partially offset by higher volumes equating to improved utilization of our assets.
Dedicated Contract Services (DCS)
- First Quarter 2025 Segment Revenue: $822 million; down 4%
- First Quarter 2025 Operating Income: $80.3 million; down 14%
DCS revenue decreased 4% during the current quarter over the same period 2024, driven by a 5% decline in average trucks partially offset by a 2% increase in productivity (gross revenue per truck per week). Productivity excluding fuel surcharge revenue increased 4% driven by contracted indexed-based price escalators and less idled equipment compared to the prior-year period. On a net basis, there were 630 fewer revenue producing trucks in the fleet by the end of the quarter compared to the prior-year period, and 23 fewer versus the end of the fourth quarter of 2024. Customer retention rates are approximately 91%.
Operating income decreased 14% from the prior-year period. The decrease was primarily driven by the lower revenue and higher insurance claim and premium expense, increased group medical costs, and higher equipment and maintenance costs. These items were partially offset by lower bad debt expense, the maturing of new business onboarded over the trailing twelve months, and greater productivity and utilization of equipment.
Integrated Capacity Solutions (ICS)
- First Quarter 2025 Segment Revenue: $268 million; down 6%
- First Quarter 2025 Operating Loss: $(2.7) million; vs. $(17.5) million in Q1’24
ICS revenue declined 6% during the current quarter versus the first quarter of 2024. Overall segment volume decreased 13% versus the prior year period. Revenue per load increased 8% compared to the first quarter of 2024 due to higher contractual and transactional rates as well as changes in customer freight mix. Contractual volume represented approximately 65% of the total load volume and 63% of the total revenue in the current quarter compared to 57% and 59%, respectively, in the first quarter of 2024.
Operating loss was $2.7 million compared to an operating loss of $17.5 million for the first quarter of 2024. Operating performance improved from the prior-year period largely due to lower personnel-related and cargo claims expenses, reduced technology costs and a reduction in acquisition-related integration and transition costs compared to the prior-year period. Gross profit increased 1% versus the prior year period due to higher revenue per load and higher gross profit margins. Gross profit margins increased to 15.3% compared to 14.3% in the prior year period. ICS carrier base decreased 3% year over year, largely driven by changes to carrier qualification requirements to mitigate cargo theft.
Final Mile Services (FMS)
- First Quarter 2025 Segment Revenue: $201 million; down 12%
- First Quarter 2025 Operating Income: $4.7 million; down 69%
FMS revenue decreased 12% compared to the same period 2024. The decrease was primarily driven by general weakness in demand across many of the end markets served. The decline in revenue was modestly offset by improved revenue quality at underperforming accounts and multiple new customer contracts implemented over the past year.
Operating income decreased 69% to $4.7 million compared to the prior-year period. The prior year period included a $3.1 million benefit from a prior period claim settlement. After consideration of this impact, operating income decreased primarily from lower revenue and higher insurance claim and premium expense and increased group medical costs. These items were partially offset by lower personnel-related costs and facility rental expense.
Truckload (JBT)
- First Quarter 2025 Segment Revenue: $167 million; down 7%
- First Quarter 2025 Operating Income: $2.0 million; up 66%
JBT revenue decreased 7% compared to the same period in the previous year. Revenue excluding fuel surcharge revenue decreased 4% due to a 6% decline in revenue per load excluding fuel surcharge revenue partially offset by a 2% increase in load volume. Total average effective trailer count decreased by approximately 800 units, or 6% versus the prior-year period. Trailer turns in the quarter improved 9% from the prior-year period as a result of the continued focus on improving asset utilization with better network balance and velocity.
JBT operating income increased 66% to $2.0 million compared to the first quarter of 2024. The increase in operating income was primarily driven by better safety results, a more balanced network, and an overall continued focus on cost management and productivity. JBT segment operating income as a percentage of segment gross revenue improved versus the prior-year period as a result of lower casualty and cargo claims and personnel-related costs as a percentage of gross revenue.
Cash Flow and Capitalization
“At March 31, 2025, we had a total of $1.58 billion outstanding on various debt instruments compared to $1.48 billion at December 31, 2024,” the company said. “Our net capital expenditures for the first quarter of 2025 approximated $225 million compared to $166 million for the first quarter of 2024.
“At March 31, 2025, we had cash and cash equivalents of $43 million. In the first quarter 2025, we purchased approximately 1,400,000 shares of our common stock for approximately $234 million. At March 31, 2025, we had approximately $650 million remaining under our share repurchase authorization. Actual shares outstanding at March 31, 2025, approximated 99.2 million.”


