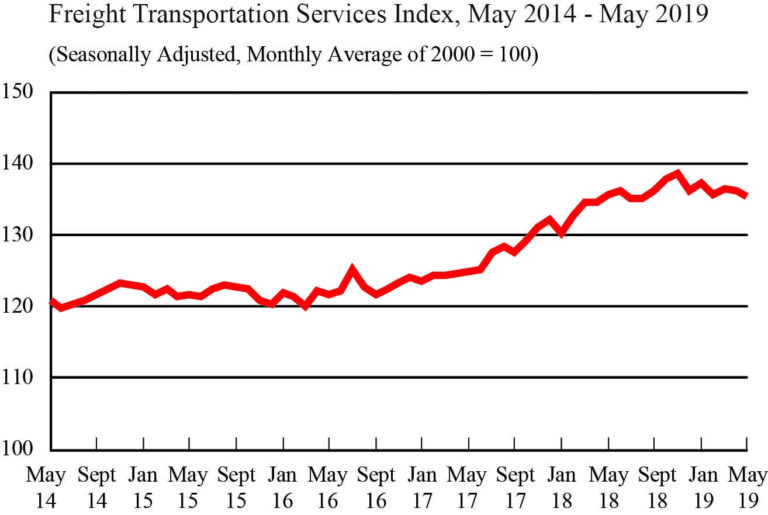
WASHINGTON — The Bureau of Transportation Statistics’ Freight Transportation Services Index (TSI), which is based on the amount of freight carried by the for-hire transportation industry, fell 0.7% in May from April, falling for the second consecutive month. From May 2018 to May 2019, the index declined 0.2% compared to a rise of 8.6% for the previous year.
The level of for-hire freight shipments in May measured by the Freight TSI (135.4) was 2.4% below the all-time high level of 138.7 in November 2018. BTS’ TSI records begin in 2000. See historical TSI data.
The Freight TSI measures the month-to-month changes in for-hire freight shipments by mode of transportation in tons and ton-miles, which are combined into one index. The index measures the output of the for-hire freight transportation industry and consists of data from for-hire trucking, rail, inland waterways, pipelines and air freight. The TSI is seasonally-adjusted to remove regular seasons from month-to-month comparisons.
The BTS said the May decline in the Freight TSI was driven by decreases in rail carloads, rail intermodal, trucking and water, while air freight and pipeline increased.
The TSI decline took place against a background of growth for other indicators. The Federal Reserve Board Industrial Production index increased by 0.4% in May, with growth in all sectors. Personal income increased by 0.5%, while housing starts grew by 0.3%. The Institute for Supply Management Manufacturing index declined from 52.8 in April to 52.1 in May, indicating continued but decelerating growth.
With the decline of 0.7% in May, the index fell for the second consecutive month, the third time in four months and the fourth time in six months for a total drop of 2.4% since peaking in November 2018. The November high followed an increase of 6.5% in the 10 months since January 2018, and of 14.1% percent in the 27 months since September 2016. The index is down 0.2% from May 2018 but up 8.4% from May 2017 and up 11.3% from May 2016. The May index was 42.8% above the April 2009 low during the most recent recession. For additional historical data, go to TSI data.
The Trucker News Staff produces engaging content for not only TheTrucker.com, but also The Trucker Newspaper, which has been serving the trucking industry for more than 30 years. With a focus on drivers, the Trucker News Staff aims to provide relevant, objective content pertaining to the trucking segment of the transportation industry. The Trucker News Staff is based in Little Rock, Arkansas.


